
Central Illinois leads corn and soybean production as numbers decline across state
By BEN ORNER
Capitol News Illinois
borner@capitolnewsillinois.com
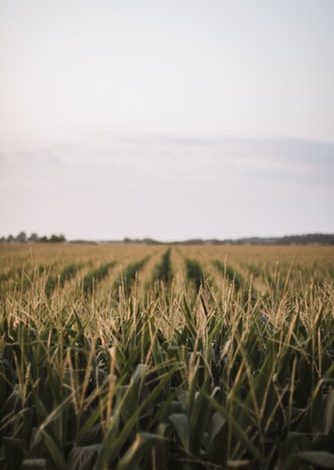
SPRINGFIELD – Central Illinois counties led Illinois in corn and soybean production last year as every region and nearly all counties saw decreases in both crops, according to estimates released last week by the U.S. Department of Agriculture.
Both production and yields for corn and soybeans fell in nearly every Illinois county for which the USDA has data for the past two years, according to an analysis by Capitol News Illinois.
The USDA published county-specific soybean figures for 75 of 102 counties and corn figures for 67 counties. Remaining counties were lumped into regional totals. All nine of Illinois’ crop-growing regions, from the cold and snowy northwest to the temperate southeast, saw production and yields decrease.
McLean County, Illinois’ largest by area and a perennial powerhouse in cash crop production, was by far the top producer of corn and soybeans, producing more than 61 million and 18 million bushels, respectively. Fellow central Illinois counties Champaign and Livingston rounded out the top three.
“The soil is good here, but is it better than anything in northern Illinois? No. Western Illinois? Probably not,” said Gerald Thompson, who grows thousands of acres of corn and soybeans in the McLean County town of Colfax.
A short drive down Interstate 55, Sangamon County topped the state in corn and soybean yields, which is the average number of bushels produced from an acre of land. Sangamon County farms averaged 206.3 bushels per acre of corn and 65.5 of soybeans.
“I think we’re all suited to compete, it’s just more of a weather issue,” Thompson said.
Production and yields were down from 2018 across the state – in many places dramatically – after heavy rain and flooding plagued farmers during the spring planting season.
Corn production dropped more than 62 percent in Illinois’ southernmost Alexander County, which sits on the conflux of the Mississippi and Ohio rivers. Another southwestern county, Perry, saw the biggest change in soybean production with 32 percent decrease.
Central Illinois’ Douglas County had the biggest drop in corn yields with a 34 percent decrease. Calhoun County, which hugs the Mississippi River north of St. Louis, had the largest drop in soybean yields with a 48 percent decrease.
“Not only do you get the challenges of the water you get,” Thompson said of farming along the Mississippi, “but you get everybody else’s water after about a week or two after it comes down the river, gets out of its banks and floods your fields.”
Though McLean County led the state in production, it was not spared by the weather. Soybean production fell nearly 10 percent, while corn production dropped 13 percent. Thompson estimates his yields for both crops were down around 10 percent.
“While I’m not singing the blues too bad, I don’t want to in any way take away from those that really did stress,” he said.
Four counties for which the USDA had data actually saw yields increase. Soybean yields in Hardin County and Lake County rose 3.46 percent and 16.71 percent, respectively, though both saw decreases in production. No county saw an increase in soybean production as Lake County fared the best with a 1.95 percent decrease.
Corn yields rose in Winnebago County (4.01 percent) and Madison County (0.25 percent). Another three counties saw production increase: Marshall (5.28 percent), Sangamon (1.95 percent) and Gallatin (1.59 percent).
Last week’s numbers are the first county-level glimpse into the plight of Illinois’ top two crops after statewide production totals released in January showed a 20 percent drop in soybean production and an 18 percent drop in corn.
Illinois last year saw its wettest January through June on record. Corn and soybeans are usually planted in the late spring, especially May. Unfortunately for farmers, the state’s wettest May on record forced many to wait until June and even July to put seeds in the ground.
“We made an extra effort to get ready for spring 2020,” said Thompson, who didn’t finish planting last year until mid-June.
The National Oceanic and Atmosphere Administration predicts a wetter-than-normal March through May for the entire state this year, especially southeastern Illinois communities along the Wabash River.
“Preparing for wetter-than-normal conditions to be more common or happen more frequently is something that farmers should be doing in Illinois,” state climatologist Dr. Trent Ford told Capitol News Illinois in January.
Ford added that scientists attribute these increasingly wet conditions to climate change.
“The connections there are pretty strong,” Ford said.
Despite the decreases in crop production, Illinois retains its status as America’s top soybean state and second-ranked corn state, behind Iowa.
2019 PRODUCTION (IN BUSHELS)
Corn
- McLean County (61,712,000)
- Champaign County (48,918,000)
- Livingston County (46,927,000)
- Iroquois County (45,786,000)
- Sangamon County (45,582,000)
Soybeans
- McLean County (18,123,000)
- Livingston County (16,121,000)
- Champaign County (13,539,000)
- LaSalle County (13,315,000)
- Iroquois County (12,391,000)
Source: U.S. Department of Agriculture
2019 YIELDS (IN BUSHELS PER ACRE)
Corn
- Sangamon County (206.3)
- Carroll County (206.1)
- Morgan County (205.8)
- Tazewell County (205.6)
- Cass County (205.6)
Soybeans
- Sangamon County (65.5)
- Carroll County (64.7)
- Morgan County (64.1)
- Macon County (63.8)
- Tazewell County (63.8)
Source: U.S. Department of Agriculture
LARGEST PRODUCTION DECREASES 2018-19
Corn
- Alexander County (-62.28%)
- Douglas County (-60.29%)
- Macon County (-49.67%)
- Jefferson County (-48.87%)
- Monroe County (-34.74%)
Soybeans
- Perry County (-32.19%)
- Clay County (-28.57%)
- Effingham County (-28.57%)
- Jefferson County (-27.24%)
- Cumberland County (-24.70%)
Source: U.S. Department of Agriculture
LARGEST YIELD DECREASES 2018-19
Corn
- Douglas County (-34.31%)
- Effingham County (-26.06%)
- Clay County (-25.78%)
- Crawford County (-24.70%)
- Alexander County (-23.46%)
Soybeans
- Calhoun County (-48.01%)
- Hardin County (-41.04%)
- Jackson County (-39.78%)
- Marion County (-36.80%)
- Clay County (-36.62%)
Source: U.S. Department of Agriculture

